


The September price distribution is being read as an affordability story. It is a supply story. A market clearing at these prices cannot build new condominiums, and CMHC’s own data shows it has already stopped trying.
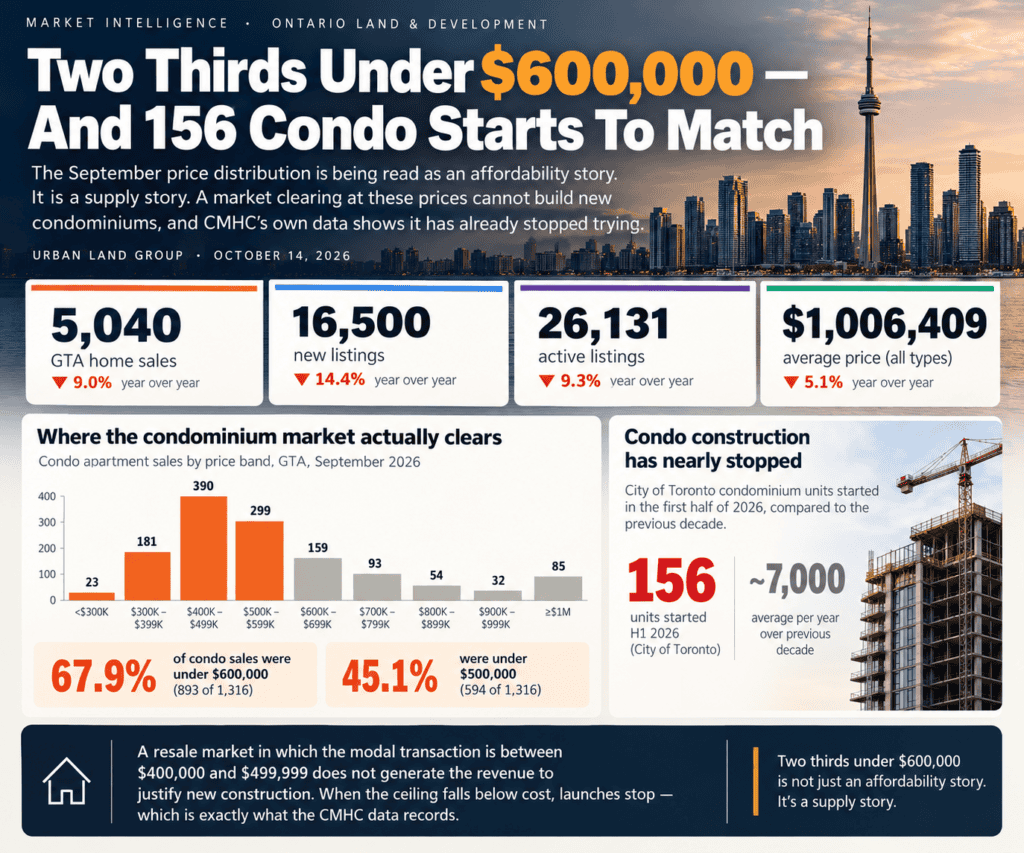
Of the 1,316 condominium apartments sold across the TRREB market area in September, 893 sold for less than $600,000 and 594 sold below $500,000. That is 67.9% and 45.1% respectively. The single largest price band was $400,000 to $499,999, with 390 sales. The average condominium apartment price was $605,257 and units sat 42 days on market.
For context on the wider market, GTA sales across all housing types were 5,040, down 9.0% year over year, on 16,500 new listings, down 14.4%. The average price across all types was $1,006,409, down 5.1%, and the MLS Home Price Index composite was down 4.7%. Within the condominium segment, 884 sales were in the City of Toronto at an average of $640,248 and 432 in the surrounding 905 regions at $533,654 — a premium of about 20% for the 416.
The wider TRREB market in September 2026. Volumes fell faster than prices.
Where the condominium market actually clears
The price-range table is the part of the release worth reading closely. The single largest band was $400,000 to $499,999, with 390 sales, and the second largest was $500,000 to $599,999 with 299. Above $700,000 the volume thins out fast, and only 85 sales in the entire month — 6.5% — were at or above $1 million.
TRREB’s own price-range table. Percentages are ULG arithmetic on those counts.
Expressed cumulatively, the same data tells a buyer or a vendor something more directly useful: what share of the market a given price actually reaches. At $500,000 a buyer is competing for about 45% of September’s transactions. At $600,000 that rises to 68%. Beyond roughly $700,000 each additional hundred thousand dollars buys access to very little extra inventory, because the market above that point is thin.
ULG calculation from TRREB’s sales-by-price-range table. The curve flattens sharply above $700,000.
How far the condominium has fallen behind the rest of the market
Against the other segments the condominium apartment is now in a category of its own. The average detached sale was $1,292,016 and the average semi-detached $1,015,202. Attached and row townhouses averaged $907,849 and condominium townhouses $710,579. The condominium apartment, at $605,257, trades at 46.8% of a detached house — a gap of $686,759 — while making up 26.1% of all sales in the month.
Condominium apartments were the second largest segment by volume and the cheapest by a wide margin.
The geographic split carries a warning that is easy to miss. The City of Toronto commands a 31.0% premium over the 905 on detached houses and 41.9% on semi-detached. On condominium apartments the premium is only 20.0%. Downtown density is the product the 416 should price at its widest margin over the suburbs, and it does not.
Premiums are ULG arithmetic on TRREB’s averages. The condominium premium is the narrowest of the three.
The number the distribution is actually telling you about
A headline about affordability reads this as good news for buyers. Put it next to the supply data and it reads differently. CMHC’s Fall 2026 Housing Supply Report, published September 10, records 156 condominium units started in the City of Toronto in the first half of 2026 — against an average of roughly 7,000 a year over the previous decade. On a Toronto CMA four-quarter moving basis, condominium apartment starts fell to 8,289 at Q2 2026 from 13,883 a year earlier and from a peak of 31,445 at Q2 2023.
Over the same period purpose-built rental apartment starts rose 82% and reached 12,062 on the same basis, overtaking condominium starts for the first time in decades. CMHC attributes the condominium collapse to weak presales, poor investor demand and high resale supply, and states that project launches have largely stalled.
The two series are on the same Toronto CMA four-quarter basis. The 156-unit City of Toronto figure is a different geography and period.
These are the same fact observed from two directions. A resale market in which the modal transaction is between $400,000 and $499,999 does not generate the revenue to justify new construction at current land, labour, development charge, HST and financing costs. The resale price is the ceiling on what a presale can be priced at, and the presale is what the construction loan is underwritten against. When the ceiling falls below cost, launches stop — which is what the CMHC data records.
What has been done about it
On June 23 the City of Toronto announced up to $1.5 billion over ten years under the Canada-Ontario Partnership to Build, tied to a Development Charge Reduction Program. Toronto will cut development charges by 40% to 60% depending on unit type between 2026 and 2029, exceeding the program’s own 30% to 50% requirement. A second phase of purpose-built rental incentives is expected to support up to 10,000 rental homes, at least 2,000 of them affordable.
That is a material reduction in a real cost. It is also a cost-side answer to a revenue-side problem, it stops at the City boundary, and it does not address presales.
Announcement terms as published by the City. The right-hand column is ULG commentary.
| THE ULG VIEW
The price distribution and the construction shutdown are one fact, not two. A resale market in which two thirds of condominium sales clear below $600,000 and nearly half below $500,000 cannot support new condominium construction at GTA land, labour, development charge and financing costs. CMHC’s own report says the same thing from the supply side: 156 condominium units started in the City of Toronto in the first half of 2026 against roughly 7,000 a year over the previous decade. Anyone reading the TRREB headline as an affordability story has read it backwards. It is a supply story about 2029 and 2030. For a land file this is the single most important repricing of the cycle. Condominium-designated sites in the GTA were underwritten on 2021 and 2022 revenue assumptions. Those assumptions are gone, and a residual land value calculation run on today’s resale evidence returns nothing — or less than nothing — for high-density residential land in much of the region. A site that was worth a number per buildable foot three years ago is not worth a lower number today; in many cases there is no condominium bid at all. The honest consequence is that there are two bids for density right now, and neither is a condominium developer. The first is rental, financed by CMHC — which is exactly why Toronto CMA rental apartment starts overtook condominium starts for the first time in decades. The second is a patient holder prepared to carry the land until the cycle turns. If you are advising a vendor on a high-density site, those are the buyers. Pricing the land to a condominium pro forma produces a listing that does not sell. Above $700,000 there is barely a market to speak of. The cumulative curve flattens almost completely past that point: four fifths of September’s condominium sales had already transacted by $700,000, and only 85 sales in the whole month were at or above $1 million. For a vendor holding a larger or premium suite that is not a pricing problem, it is a liquidity problem — the buyer pool thins to almost nothing. Read the average price with care — the median is lower. The reported average of $605,257 sits above the band where the median sale actually falls, because eighty-five sales above $1 million pull the mean up. For a buyer, a vendor or an appraiser, the modal transaction in this market was between $400,000 and $499,999, which was the single largest band at 390 sales. The 416 is still carrying a 20% premium over the 905, and that gap is the thing to watch. City of Toronto condominium sales averaged $640,248 against $533,654 in the surrounding regions. If that spread compresses further, the suburban condominium product that was built on investor demand between 2017 and 2022 is where the next leg of pain lands — and that is the stock sitting in Mississauga, Vaughan and Markham, not downtown. The development charge cut is real money and it is still not the binding constraint. Toronto will cut development charges 40% to 60% by unit type between 2026 and 2029, funded by up to $1.5 billion over ten years. That genuinely improves project viability. But it moves a cost line in a market where the revenue line fell about 7.7% in a year, it applies only inside the City of Toronto, and it does nothing about presales — which is precisely what CMHC identifies as the reason launches stalled. Expect it to help rental conversions and stalled sites with sunk land, not to restart speculative condominium development. |
| WHAT IS CONFIRMED AND WHAT IS NOT
TRREB is industry data, not an official statistic. The Toronto Regional Real Estate Board is a real estate board publishing its own members’ MLS activity. It is the primary source for these figures and there is no government equivalent at monthly frequency, but it should be cited as board data. Statistics Canada’s New Housing Price Index and CMHC’s surveys measure different things and will not reconcile to it. The percentages are ours, computed from the board’s table. TRREB publishes the sales-by-price-range counts; the 67.9% and 45.1% figures are arithmetic on those counts. They agree with the trade coverage that prompted this note. The year-over-year condominium price change is read from a table whose columns we could not fully resolve. We read the condominium apartment row as sales down about 7.8% and average price down about 7.7%. Confirm against TRREB’s own summary before quoting it. The starts figures are on two different bases. The 156-unit figure is City of Toronto, first half of 2026. The 8,289 and 12,062 figures are Toronto CMA four-quarter moving sums at Q2 2026, which is a wider geography and a different period. They are not comparable to each other and should not be added. The development charge reduction is announced, not yet reflected in a rate schedule here. The City’s release states a 40% to 60% reduction by unit type between 2026 and 2029 but does not publish the per-type figures in that release. The City is also running a comprehensive development charge review into 2027, so rates may change again. Nothing here is a view on any specific site. Residual land value turns on the actual site, its approvals, its servicing and its unit mix. These are market-level observations only. |
SOURCES
Official and primary sources
- CMHC — Fall 2026 Housing Supply Report, September 10, 2026 (Toronto condominium and rental apartment starts) https://www.cmhc-schl.gc.ca/professionals/housing-markets-data-and-research/market-reports/housing-market/housing-supply-report
- City of Toronto — City secures $1.5 billion in Canada-Ontario Partnership to Build funding to support housing and reduce development charges, June 23, 2026 https://www.toronto.ca/news/city-of-toronto-secures-1-5-billion-in-canada-ontario-partnership-to-build-funding-to-support-housing-and-reduce-development-charges/
- City of Toronto — Development charges: bylaws, rates and study https://www.toronto.ca/city-government/budget-finances/city-finance/development-charges/bylaws-rates-study/
- City of Toronto — Council item 2025.EX21.13, deferral of development charges for condominium units https://secure.toronto.ca/council/agenda-item.do?item=2025.EX21.13
Board and trade sources (not official)
- Toronto Regional Real Estate Board — Market Watch, September 2026 (the primary source for every sales and price figure here) https://trreb.ca/hlfiles/pdf/mw_september_2026_564895214753249.pdf
- TRREB — Market Watch archive https://trreb.ca/market-news/market-watch/
- Storeys — Two Thirds Of GTA Condos Sold For Less Than $600K In September https://storeys.com/gta-condos-trreb-market-watch/
Prepared by Gagan verma a registered sales representative with Royal LePage Signature Realty, Brokerage. This document is market commentary prepared for discussion purposes. All arithmetic identified as ULG calculation is our own and is not sourced from TRREB, CMHC or any government body. Nothing here is an appraisal, an Opinion of Value, or investment, legal or tax advice, and nothing here is a statement of value for any particular property.